Project vehicles entering Cedar
—
The Draft MND and its traffic and evacuation appendices never calculate how long it takes to evacuate Cedar Street — the street the project names as its main way in and out. Appendix I times North Ventura Avenue. Appendix H1 checks ordinary peak-hour traffic. Neither answers how long Cedar itself takes to empty.
This model fills that gap using the applicant’s own inputs: their project vehicle counts (194 at 1 PM, 291 at 9 PM, 303 overnight) and their published 20% / 20% / 60% split to School Canyon, Willett and Seneca, with the School Canyon gate open at minute zero.
Every case was run 1,500 times in a Monte Carlo queueing model of the three Cedar intersections. It is a screening estimate by a resident, not a certified traffic study — and a City analysis should replace it.
The applicant’s Fire Scenario 1 reports a 580 ft/min rate of spread, 54.8-ft flame length and 2.7-mile spotting distance. As a constant-rate unit conversion, 580 ft/min is about 9.1 minutes per mile.
That is not a prediction of when a fire arrives — real spread depends on fuel, slope, wind, spotting and suppression. The point is that the Draft MND never places these fire-behavior outputs beside a Cedar-specific evacuation time. It should.
Median Cedar clearance is the time at which the last project vehicle clears its local branch — Cedar to Alabama for the Willett share, Cedar through Alabama, Chickasaw and Seneca for the Seneca share — with existing neighborhood traffic competing for the same junctions. It is not the time to reach safety, and it stops before North Ventura Avenue.
P90 is the slower one run in ten under the same assumptions.
Project queue at Cedar/Alabama counts only project vehicles waiting at the first junction. Existing residents’ cars add to the contention but are not in this count.
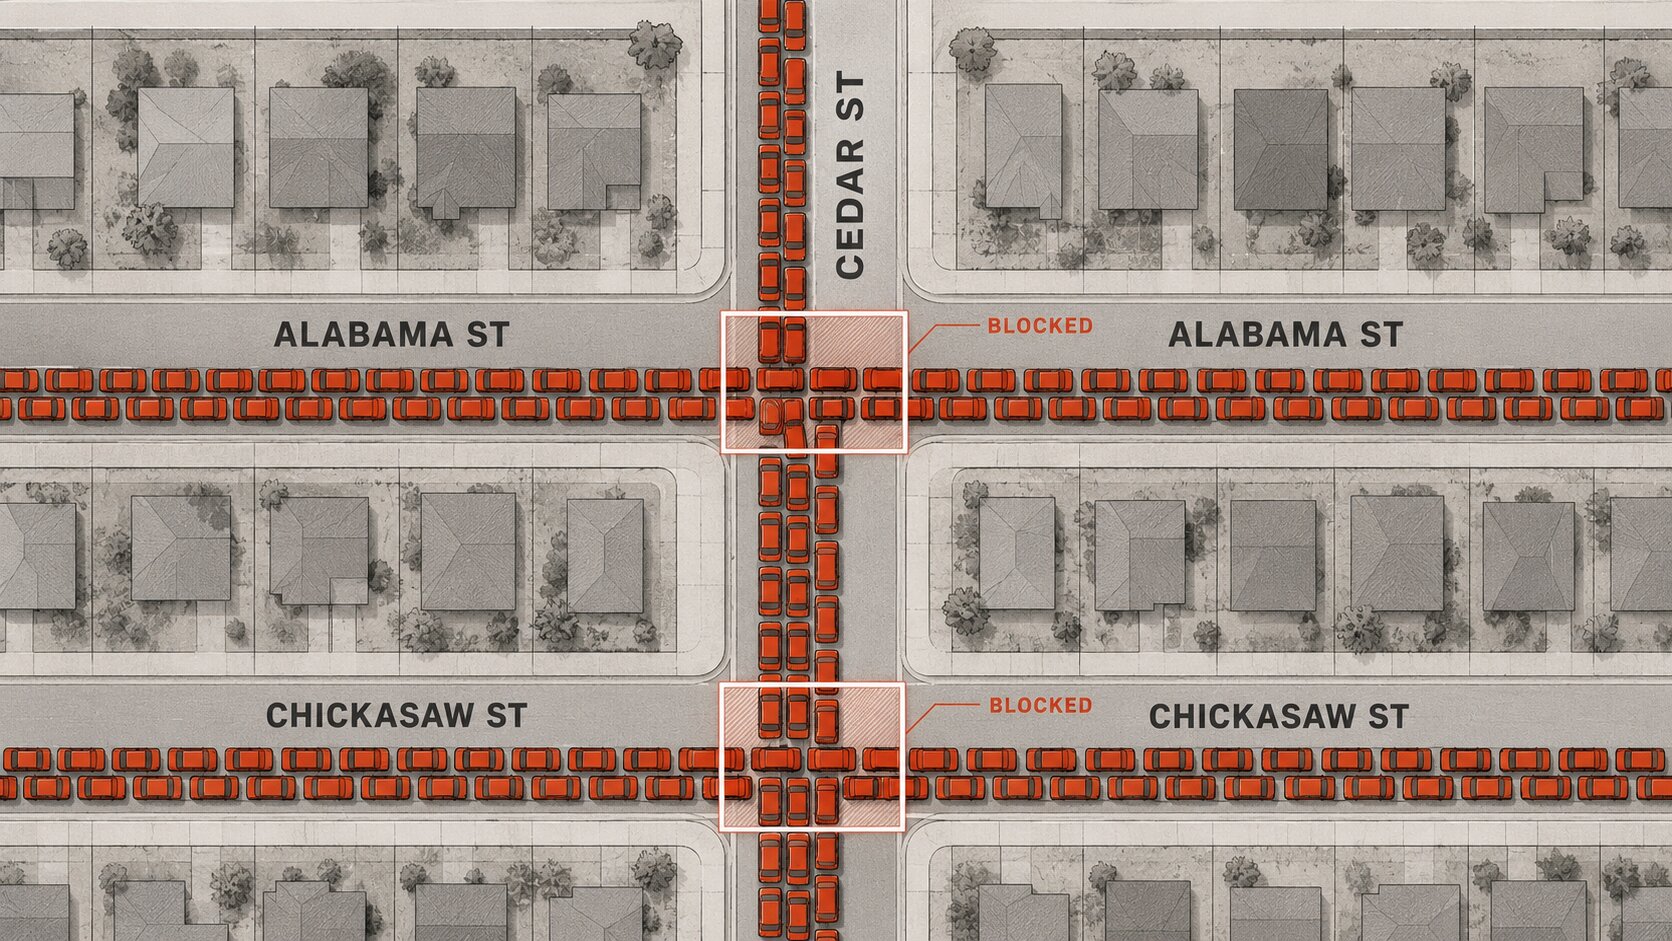
Standing length converts that queue at 25 ft per stopped car. Only 142 ft of Cedar — about five cars — lies between the project boundary and Alabama. If the queue is contiguous, everything past that has to stand on the project’s own internal streets.
Junction throughput is the one number that moves the answer most, and nobody has measured it. 600–950 veh/hr are sensitivity rates, not claimed Cedar capacities.
Every project document identifies Cedar Street as the main local access. Appendix K says the project’s main ingress and egress will be from Cedar Street, extending south to Seneca. Yet the dedicated evacuation analysis only calculates travel times on North Ventura Avenue.
| Document | What it analyzes | What remains missing |
|---|---|---|
| Appendix H1 — Traffic Impact Study | Ordinary peak-hour intersection operations; earlier emergency evaluation on N. Ventura Ave | No Cedar evacuation clearance time |
| Appendix I — Evacuation Analysis | N. Ventura Ave north and south of Seneca; project distribution 20/20/60 | No project-driveway-to-Seneca Cedar clearance calculation |
| Appendix K — Fire Protection Plan | Fire behavior; project fire access; School Canyon EVA gate | No direct comparison of Cedar clearance with modeled fire behavior |
Appendix I sends project evacuation traffic to three exits: 20% School Canyon Road, 20% Willett Street, 60% Seneca Street. With the gate open, 80% of project traffic enters Cedar and 60% continues through all three Cedar intersections.
| Scenario | Project demand | School Canyon 20% | Willett 20% | Seneca 60% | Entering Cedar |
|---|---|---|---|---|---|
| 1 PM | 194 | 39 | 39 | 116 | 155 |
| 9 PM | 291 | 58 | 58 | 175 | 233 |
| Overnight | 303 | 61 | 61 | 181 | 242 |
Median project-vehicle clearance by project demand and junction throughput. The highlighted cell follows the controls above. Across every condition tested, the median runs from about 16 to 33 minutes.
| Project demand | 600 veh/hr | 750 veh/hr | 900 veh/hr | 950 veh/hr |
|---|
| Scenario | Median project queue | Standing length | Beyond 142-ft Cedar segment |
|---|---|---|---|
| 1 PM / 750 veh/hr | 34 veh | 850 ft | ~708 ft |
| 9 PM / 750 veh/hr | 93 veh | 2,325 ft | ~2,183 ft |
| Overnight / 750 veh/hr | 100 veh | 2,500 ft | ~2,358 ft |
| 9 PM / 600 veh/hr | 121 veh | 3,025 ft | ~2,883 ft |
| Overnight / 600 veh/hr | 128 veh | 3,200 ft | ~3,058 ft |
| 9 PM / 750 — all existing traffic moved below Alabama | 47 veh | 1,175 ft | ~1,033 ft |
| Case | Veh / hh | Vehicles | Median | P90 |
|---|---|---|---|---|
| Appendix H1 rate | 1.50 | 71 | 25.26 | 31.15 |
| Carr Fire lower bound | 1.74 | 82 | 26.13 | 31.82 |
| Local survey | 2.00 | 94 | 27.08 | 33.03 |
| Gate opens | Gate users | Into Cedar | Median | P90 |
|---|---|---|---|---|
| Minute 0 | 58 | 233 | 26.13 | 31.82 |
| Minute 5 | 39 | 252 | 27.95 | 33.86 |
| Minute 10 | 19 | 272 | 29.34 | 35.75 |
| Minute 15 | 0 | 291 | 30.64 | 37.22 |
| Window | Median | P90 | All-traffic queue at J1 |
|---|---|---|---|
| Instantaneous | 26.12 | 31.94 | 315 veh |
| 15 minutes | 26.13 | 31.82 | 127 veh |
| 30 minutes | 30.34 | 32.56 | 10 veh |
| Replications | Median | P90 | Queue |
|---|---|---|---|
| 500 | 26.29 | 32.58 | 93 veh |
| 1,500 | 26.13 | 31.82 | 93 veh |
| 5,000 | 26.15 | 31.82 | 94 veh |
In the central case — 9 PM demand, 750 veh/hr junction throughput, 1.74 vehicles per household, gate open — median clearance is 26.13 minutes and the slower one run in ten is 31.82 minutes. Across every condition tested, the median ranges from about 16 to 33 minutes. That is the local Cedar number alone, before anyone reaches North Ventura Avenue.
The central case leaves 93 project vehicles waiting at Cedar/Alabama. At 25 ft per stopped car, that is 2,325 ft of traffic. Only 142 ft of Cedar — about five car lengths — lies between the project boundary and Alabama. As a contiguous single-lane queue, the remaining 2,183 ft would have to stand on the project’s internal streets, the same streets fire apparatus would need.
Even the most project-favorable assumption tested — moving every existing neighborhood vehicle below Alabama, even though that overstates the relief — still leaves 47 vehicles, about 1,175 ft.
Moving Cedar junction throughput from 950 to 600 veh/hr moves median clearance at 9 PM from 20.68 to 32.64 minutes; overnight, from 21.14 to 33.39. No field measurement or capacity analysis of Cedar under evacuation demand appears anywhere in the record. The largest uncertainty is not Monte Carlo sampling error — it is this physical input, and how many existing vehicles use each Cedar segment.
Appendix I credits School Canyon with 20% of project traffic. If the gate isn’t open when those residents are ready to leave and they redirect onto the other published routes, more of the project enters Cedar: a 15-minute delay puts all 291 vehicles on Cedar and pushes median clearance to 30.64 minutes (P90 37.22). The record should say who or what opens the gate, and how long after an evacuation order civilians can actually use it.
With the gate open, only 80% of project demand enters Cedar and only 60% continues south of Alabama — at 9 PM, 233 and 175 vehicles. But School Canyon, Willett and Seneca all feed the same southbound North Ventura system. Appendix I’s own unmanaged “Worst Case Scenario” south of Seneca already runs over four hours:
| Appendix I, unmanaged case | Without project | With project | Increment |
|---|---|---|---|
| 1 PM — south of Seneca | 248.49 min | 266.92 min | ~18 min |
| 9 PM — south of Seneca | 247.35 min | 274.99 min | ~28 min |
The local and regional questions should stay distinct — but linked. School Canyon and Willett reduce the number of project vehicles on Cedar. They do not create a new regional arterial.
Appendix I page 30 defines capacity as C = N × s × g, and Exhibits 20–21 show 1,700 vphpl (1 lane), a 37.16% green-time value and an adjusted capacity of 631.653 veh/hr. But 0.14 ÷ 0.371 is about 37.7%, not 37.16% — possibly unrounded V/C values. The consultant should identify them, the number of southbound lanes, and the basis for the effective-green figure.
Appendix I also disagrees with itself at 9 PM: the page 33 narrative states an 18-minute project increment north of Seneca, while Exhibit 21 shows about 99 minutes without the project and 110 with it, and Exhibit 22 reports +11 minutes. And the overnight period, when project demand peaks at 303 vehicles, was never analyzed at all.
Each is written so it can be answered separately in the response-to-comments matrix. Borrow any of them for your own comment letter.
| Input | Treatment | Basis / interpretation |
|---|---|---|
| Project demand | 194 at 1 PM; 291 at 9 PM; 303 overnight | Appendix I Exhibit 6 / Appendix A |
| Project routing | 20% School Canyon / 20% Willett / 60% Seneca | Appendix I p. 18 |
| Mapped existing local households | 47 households | Resident field mapping, September 2026 |
| Existing vehicles per household | 1.50 / 1.74 / 2.00 sensitivity | 1.50 matches the Appendix H1 emergency assumption; 1.74 is a resident-derived lower bound from Carr Fire personal-vehicle mode shares (Wong et al. 2020); 2.00 is a local-observation sensitivity from resident reports and is not treated as statistically representative |
| Departure window | Uniform over 15 minutes in primary case | Instantaneous and 30-minute sensitivities also tested |
| Cedar control points | Alabama, Chickasaw, Seneca represented separately | Three unsignalized intersections listed in Appendix H1 |
| Service-rate sensitivity | 600 / 750 / 900 / 950 veh/hr at each Cedar control point | Sensitivity range only; no value is claimed as measured Cedar evacuation capacity |
| Run-to-run headway variation | CV 0.18 independently at each control point | Monte Carlo sensitivity around the selected mean service rate |
| School Canyon gate | Available at minute 0 in primary case | Delay sensitivities at 5, 10 and 15 minutes |
| Willett / School Canyon after local exit | Unconstrained in resident local model | Project-favorable omission; downstream travel is not modeled here |
| Spillback / crashes / apparatus counterflow | Not modeled | Project-favorable omission; results are not a worst-case prediction |
| Standing queue-space conversion | 25 ft / vehicle | Screening conversion used only to translate simulated queue counts into linear storage |
| Project boundary to Alabama | 142 ft | Resident field measurement; about five full 25-ft standing-vehicle spaces |
| Replications | 1,500 per cell, seed base 20260917 | Central case repeated at 500 and 5,000 to confirm convergence |
This is a screening model prepared by a resident, not a certified traffic or evacuation study. It is a Monte Carlo queueing model of the local Cedar corridor — not a traffic microsimulation — built to test whether local clearance is materially sensitive to reasonable changes in demand, junction service and gate timing.
These limits are why this model should not be used to declare a precise real-world evacuation time — and why a calibrated, Cedar-specific City analysis would give the Planning Commission the missing local number. This model identifies and bounds that missing calculation. It does not replace professional evacuation engineering.